Difference between revisions of "SRM-Online represented practically"
From SRM Ergometer Fokus:Diagnostik
| Line 34: | Line 34: | ||
*By clicking on ''Prev. Step'' / ''Next Step'' you can, depending on what you have adjusted at the ''Predefined File'' level, go back to the previous step / marker or jump forward to the next step / marker. | *By clicking on ''Prev. Step'' / ''Next Step'' you can, depending on what you have adjusted at the ''Predefined File'' level, go back to the previous step / marker or jump forward to the next step / marker. | ||
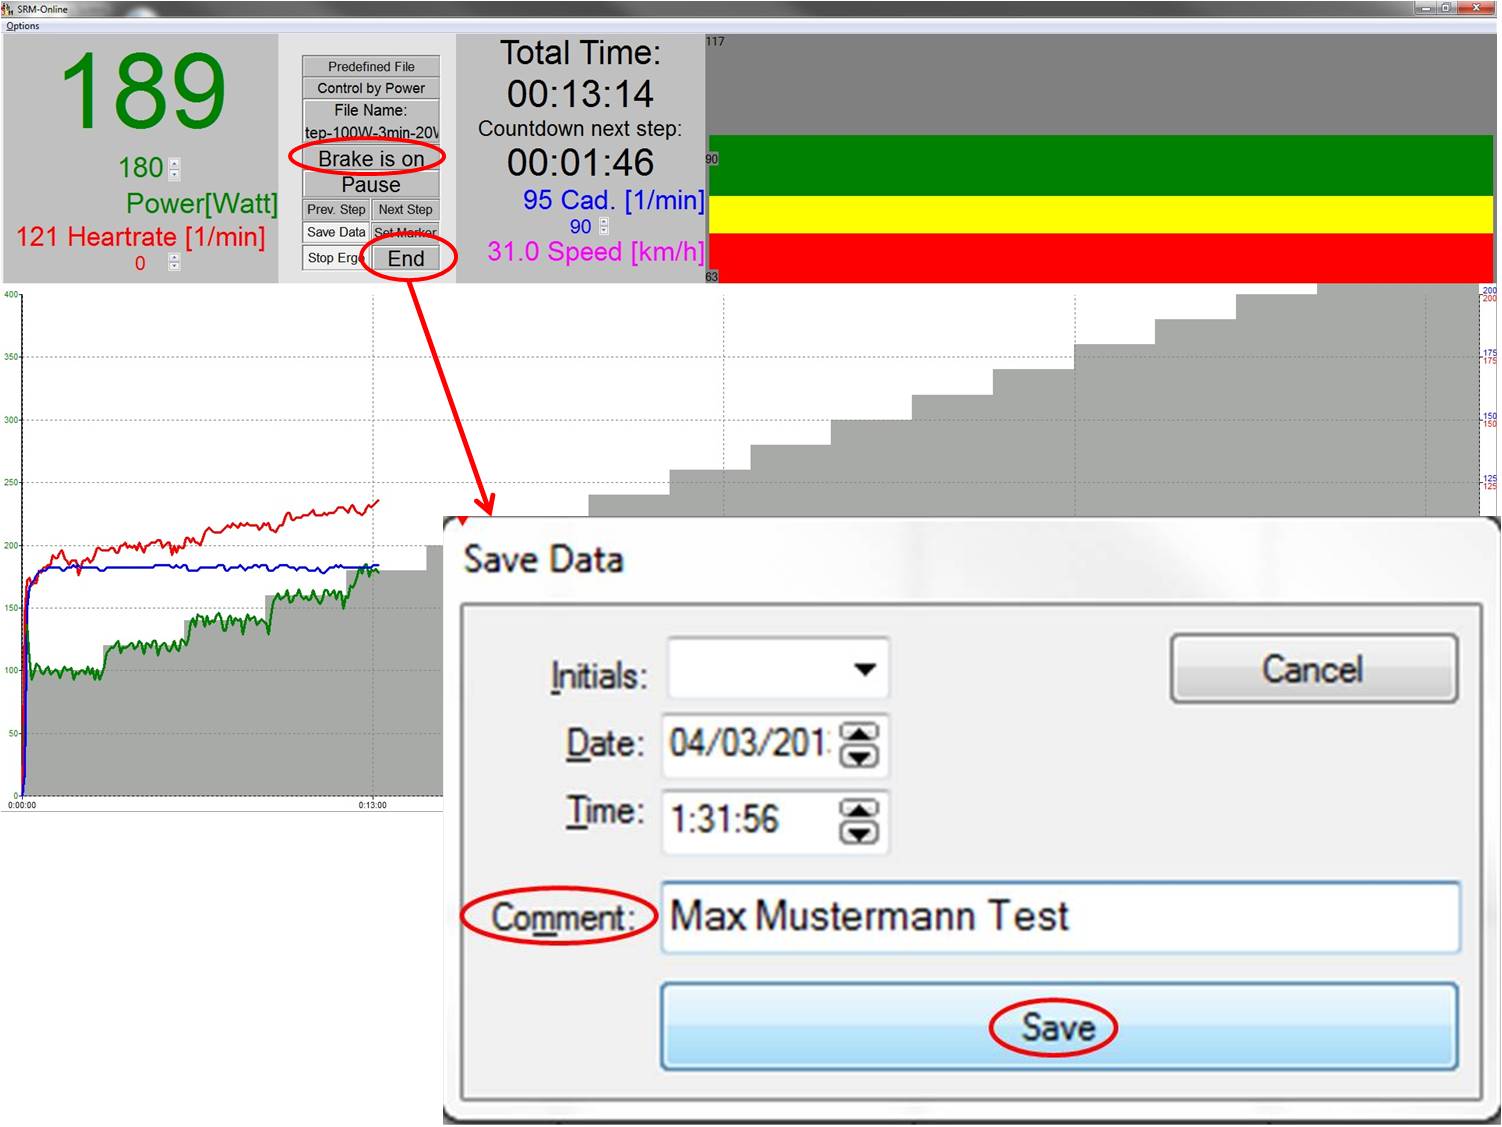
| − | * | + | *If you are done with the test, click on [[Media:Testdaten_speichern.jpg|''Save Data'']] to save the test. You can give remarks to the training under ''Comment''. You can also make modifications for the Initials (''Initials''), the date (''Date'') and the time (''Time''). To complete everything successfully, please click on ''Save''. |
| − | * | + | *By clicking of ''Set Marker'', you can place markers during the test. |
| − | *''Stop Ergo'' | + | *''Stop Ergo'' works only in connection with the Ergometer. |
| − | * | + | *You can end the test and leave the online program by clicking on ''Exit'' / ''End''. |
Revision as of 11:14, 31 March 2014
|
Languages |
|---|
Contents
Introduction
In the following sections, you can see programmed protocols to perform several performance tests.
Hyperbolic performance testing (incremental stress test)


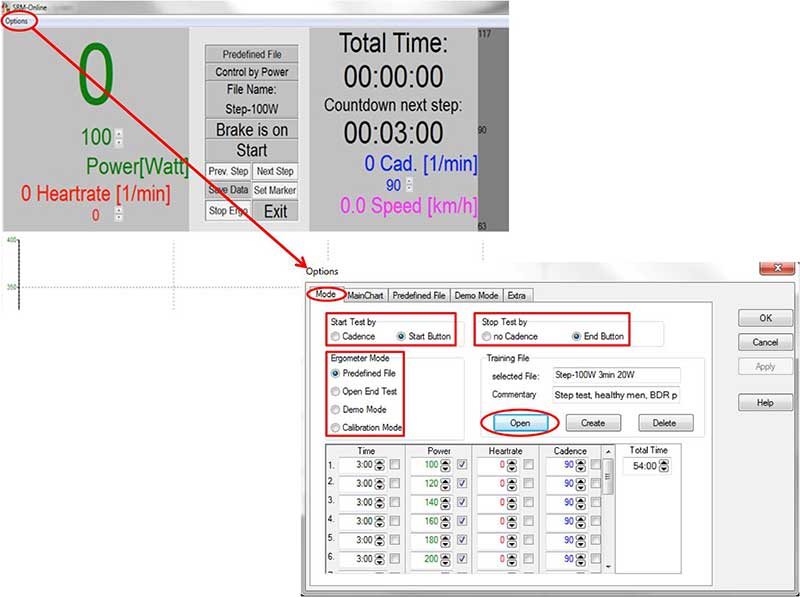
You can see two examples of an incremental hyperbolic stress test on the right hand side. The first image shows you the protocol which was programmed under the “Mode” tab. This particular one starts at 100 W over 3 min and will be increased by 20 W every 3 min.
- The colored bars in the upper right area have the following function:
- At 90 to 100 % completion of the cadence guideline, the bar stays green. At 80 to 90 % completion the bar turns yellow and at 70 to 80 % it turns red. There is no display of larger deviations.
- under Total Time you can see the ridden time so far
- under Countdown next step next step you can see the remaining time until proceeding to the next step
- The current cadence is shown blue colored
- The speed is shown pink colored
- The current heart rate value is represented with a red line on the lower part of the monitor image. The power is represented by a green line and the cadence by a blue one.
- The graphic scaling adjusts automatically to the produced power.
The intermediate status display has the following functions:
- Display of the kind of test you are performing:Predefined File, Open End oder Demo.
- Showing after which guideline you train at the moment: Control by Power, Control by Cadence or Control by Heartrate.
- The name of the file: here File Name: Test.
- No Brake or Brake on works only in combination with an Ergometer.
- Start, Pause or Resume to start, pause or resume the test. Start appears only if you have activated the start button at Start Test by in the Mode tab Should you have activated Cadence at Start Test by, aktiviert haben, the test starts when there is cadence present.
- By clicking on Prev. Step / Next Step you can, depending on what you have adjusted at the Predefined File level, go back to the previous step / marker or jump forward to the next step / marker.
- If you are done with the test, click on Save Data to save the test. You can give remarks to the training under Comment. You can also make modifications for the Initials (Initials), the date (Date) and the time (Time). To complete everything successfully, please click on Save.
- By clicking of Set Marker, you can place markers during the test.
- Stop Ergo works only in connection with the Ergometer.
- You can end the test and leave the online program by clicking on Exit / End.
- Im linken oberen Feld sehen Sie die vier farbigen Anzeigen für Power (Leistung), Heartrate (Herzfrequenz), Cadence (Trittfrequenz) und Speed (Geschwindigkeit). Die größere obere Zahl zeigt immer den Momentanwert, die untere kleinere immer die Vorgabe für den momentanen Block. Die Unterschiede zwischen tatsächlicher Leistung und gewünschter Leistung liegt an der natürlichen Leistungsschwankung des Sportlers. Differenzen von 5 % sind durchaus normal. Im Mittel über den zu regelnden Zeitraum wird die Abweichung jedoch kleiner als 1 % sein.
- Mit den Pfeil - Buttons (hoch / runter) können Sie während des Tests die derzeitige Vorgabe (Leistung, Herzfrequenz, Trittfrequenz) erhöhen bzw. minimieren.
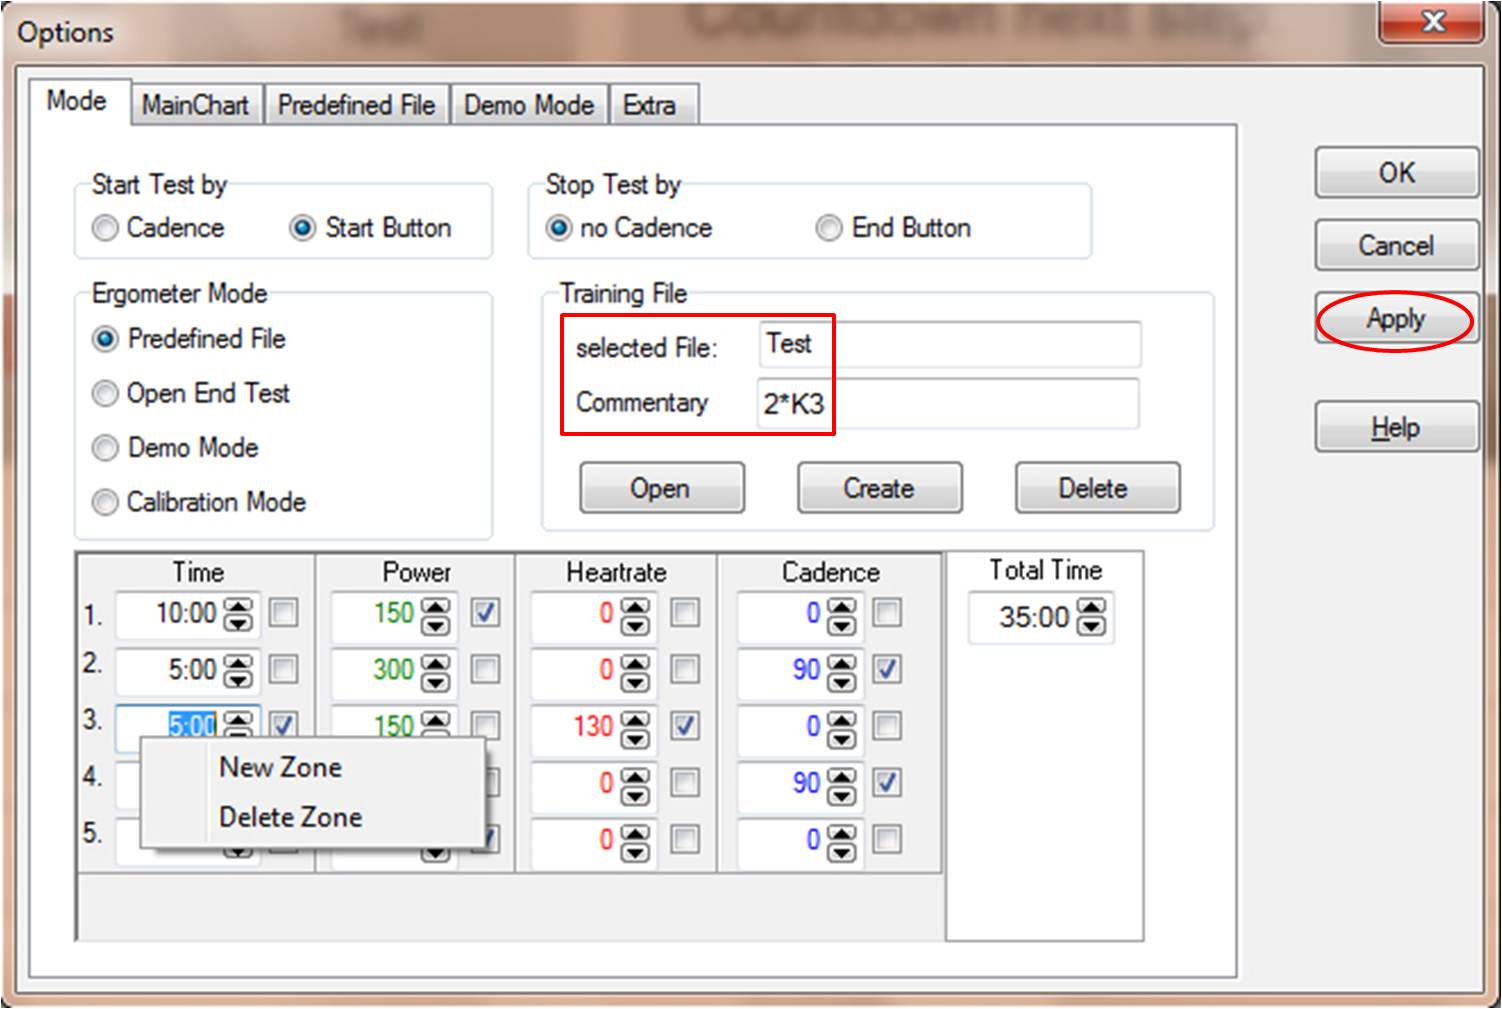
Isokinetischer Leistungstest


- der erste graue Block entspricht der ersten Leistungsvorgabe über 100 Watt
- der zweite blaue Block entspricht einer Trittfrequenzvorgabe über 90 UpM
- der dritte rote Block entspricht der Herzfrequenzvorgabe 130
- Wenn Sie nach Leistungs- oder Herzfrequenzvorgabe (Leistung oder Herzfrequenz ist in dieser Stufe mit einem Haken markiert) trainieren, zeigen die Balken die Trittfrequenzvorgabe. Er dient zur Orientierung des Sportlers und hat keinen Einfluss auf die Regelung. Er stellt immer den nicht geregelten Parameter dar.
Herzfrequenzgesteuerter Leistungstest
- Die Vorgabe im Protokoll auf dem Bildschirm erscheint in der Farbe rot, wenn sie Heartrate abgehakt haben in der Mode - Registerkarte.
Open End Test

- Durch Auswahl von Open End Test werden ausschließlich die Echtzeit Daten auf dem Bildschirm dargestellt.
- Es werden die insgesamt gefahrenen Kilometer angezeigt im mittleren oberen Bildschirm.
- Im linken oberen Feld kann mit den Pfeilbuttons (hoch, runter) neben der kleinen grauen Zahl der Widerstand grob verändert werden. Die Skalierung reicht von 0 bis 10.