SRM-Online represented practically
|
Languages |
|---|
Contents
Introduction
In the following sections, you can see programmed protocols to perform several performance tests.
Performance tests
Hyperbolic performance testing (incremental stress test)


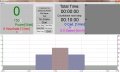
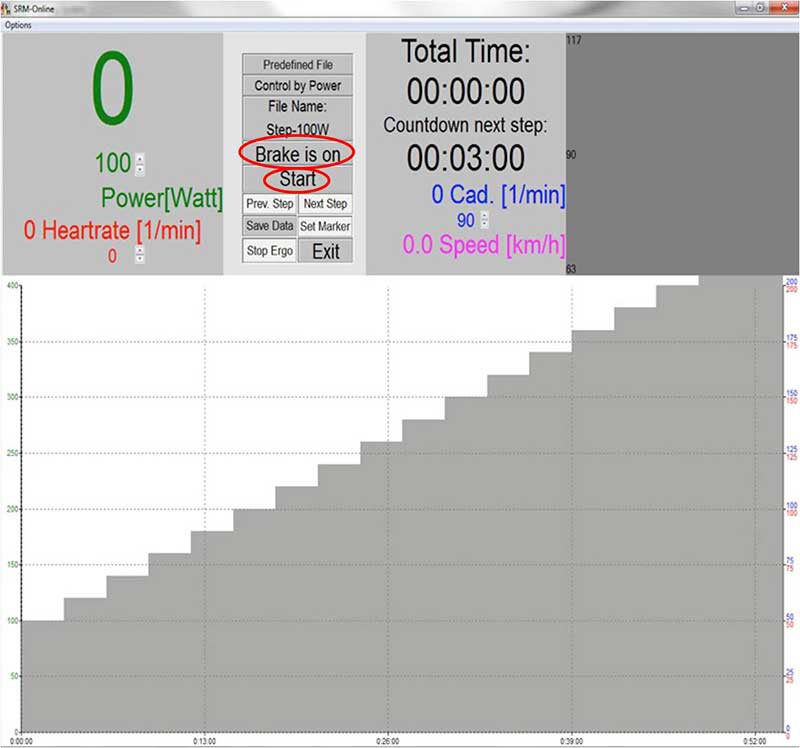
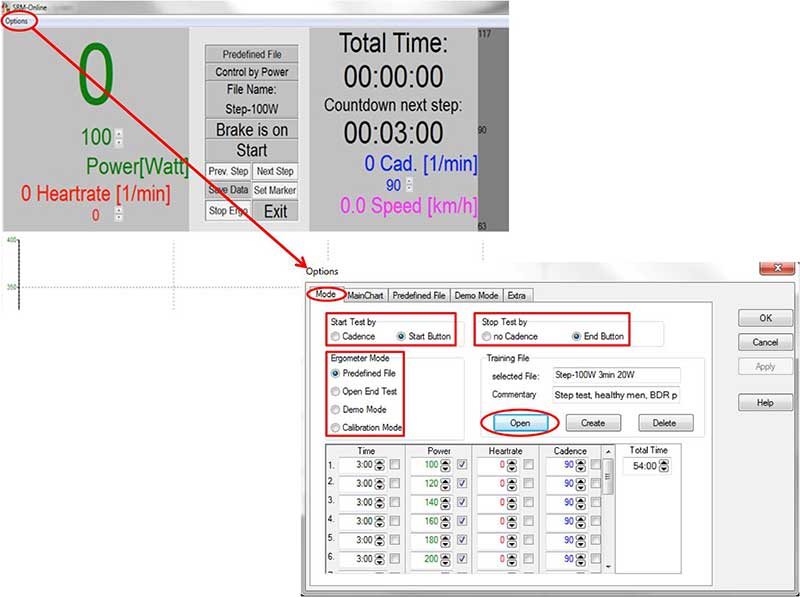
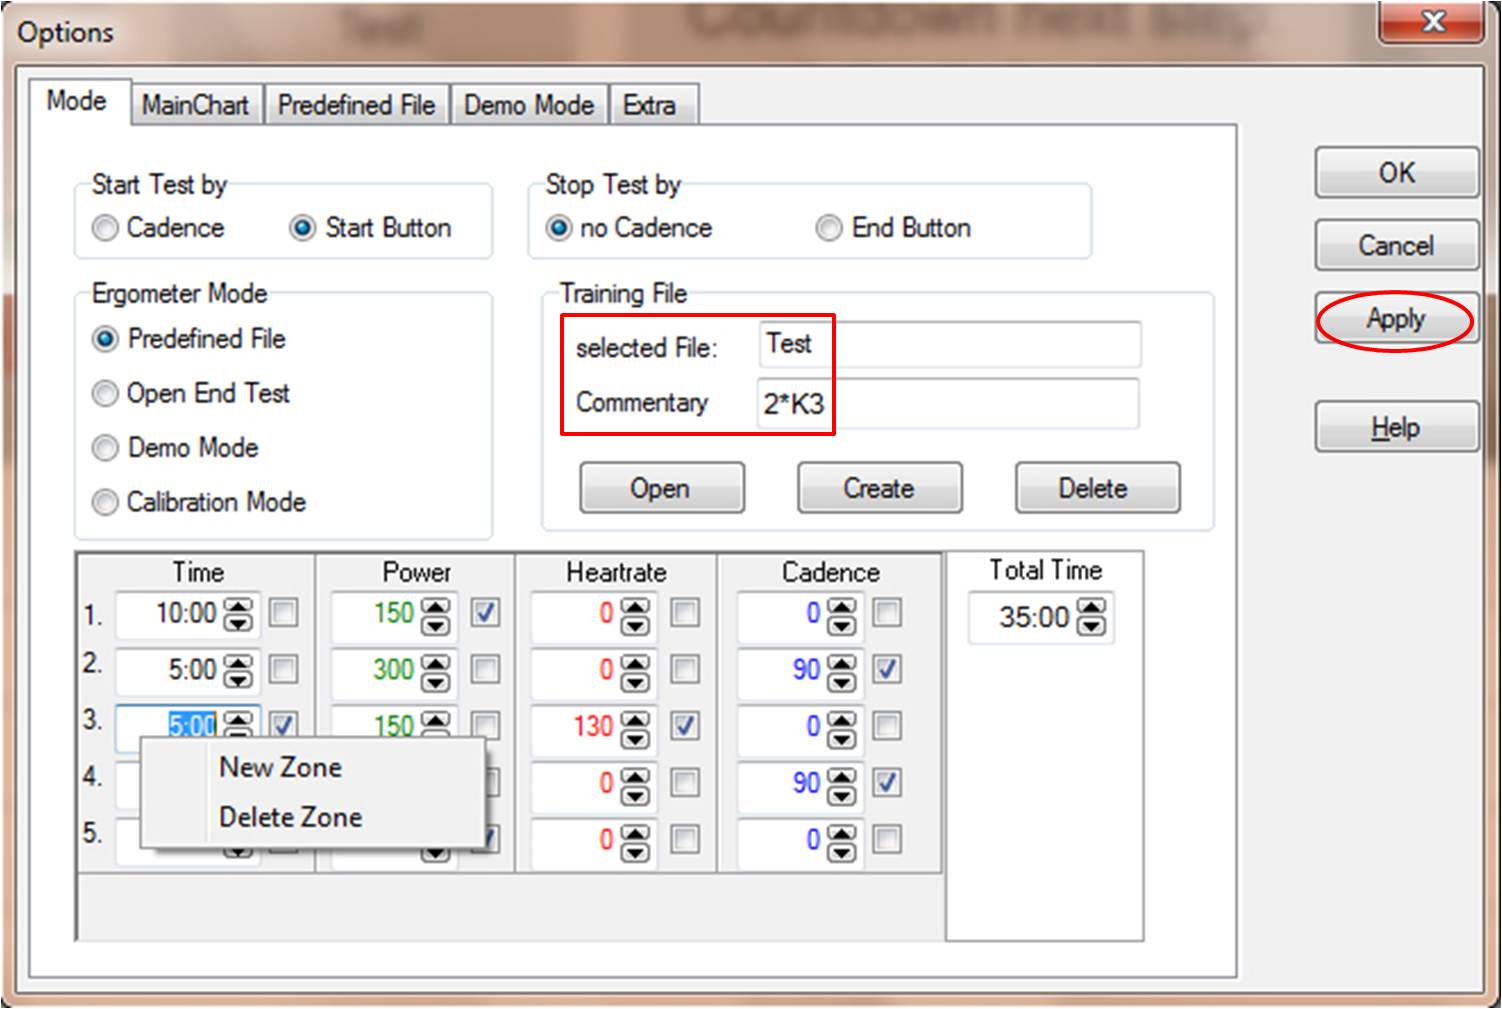
You can see two examples of an incremental hyperbolic stress test on the right hand side. The first image shows you the protocol which was programmed under the Mode tab before starting the stress test. This particular one starts at 100 W over 3 min and will be increased by 20 W every 3 min.
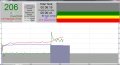
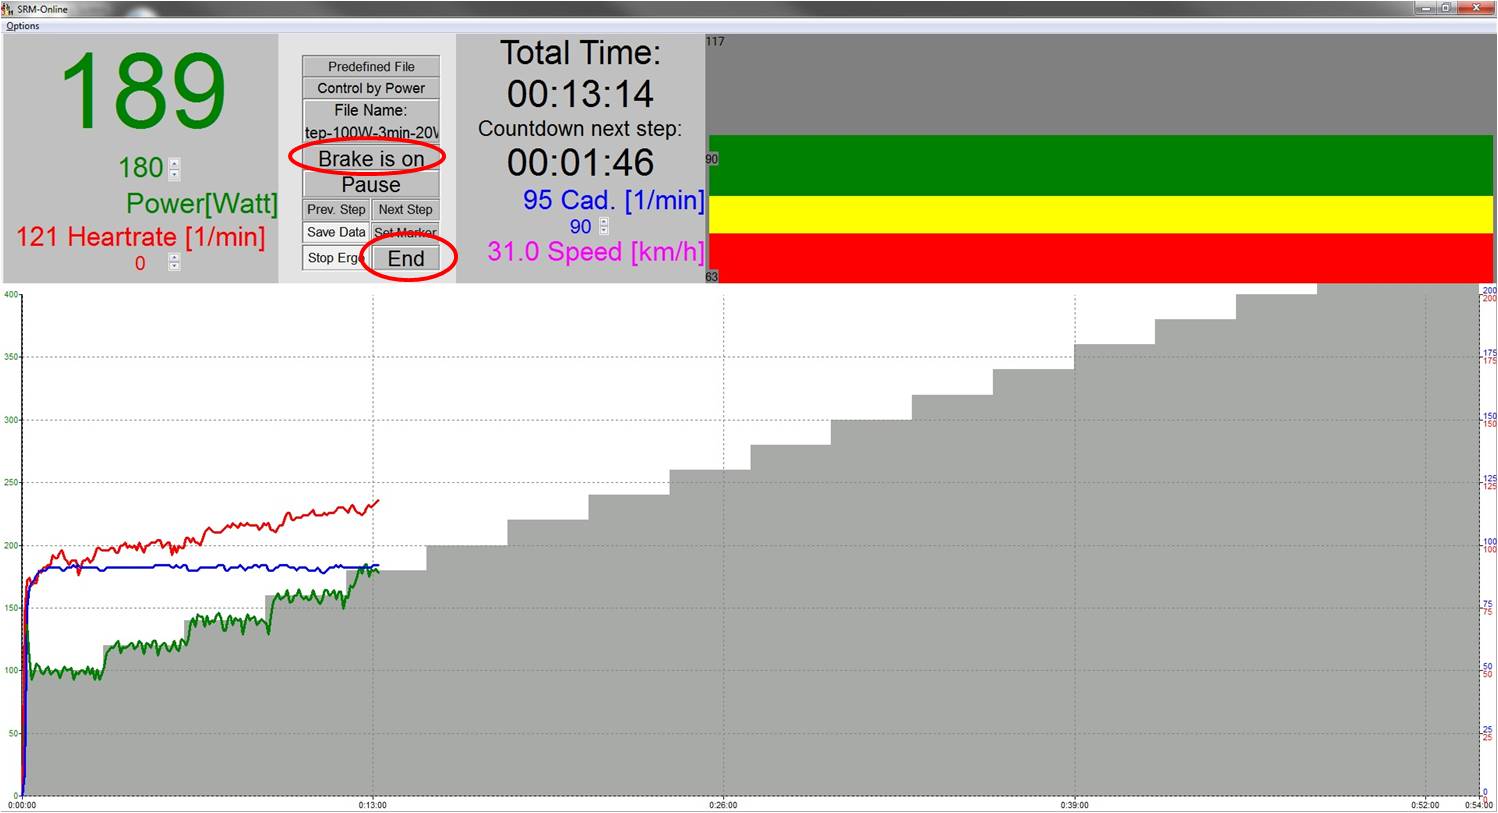
The second image shows you the data and guidelines during the incremental hyperbolic stress test.
- The current power is shown green colored
- The current heartrate is shown red colored
- The current cadence is shown blue colored
- The current speed is shown pink colored
- The current heart rate value is represented with a red line on the lower part of the monitor image. The power is represented by a green line and the cadence by a blue one.
- The graphic scaling adjusts automatically to the produced power.
- Under Total Time you can see the ridden time so far
- Under Countdown next step you can see the remaining time until proceeding to the next step
- The colored bars in the upper right area have the following function:
- At 90 to 100 % completion of the cadence guideline, the bar stays green. At 80 to 90 % completion the bar turns yellow and at 70 to 80 % it turns red. There is no display of larger deviations.
The intermediate status display has the following functions:
- Display of the kind of test you are performing:Predefined File, Open End oder Demo.
- Showing after which guideline you train at the moment: Control by Power, Control by Cadence or Control by Heartrate.
- The name of the file: here File Name: Test.
- No Brake or Brake on works only in combination with an Ergometer.
- Start, Pause or Resume to start, pause or resume the test. Start appears only if you have activated the start button at Start Test by in the Mode tab Should you have activated Cadence at Start Test by, aktiviert haben, the test starts when there is cadence present.
- By clicking on Prev. Step / Next Step you can, depending on what you have adjusted at the Predefined File level, go back to the previous step / marker or jump forward to the next step / marker.
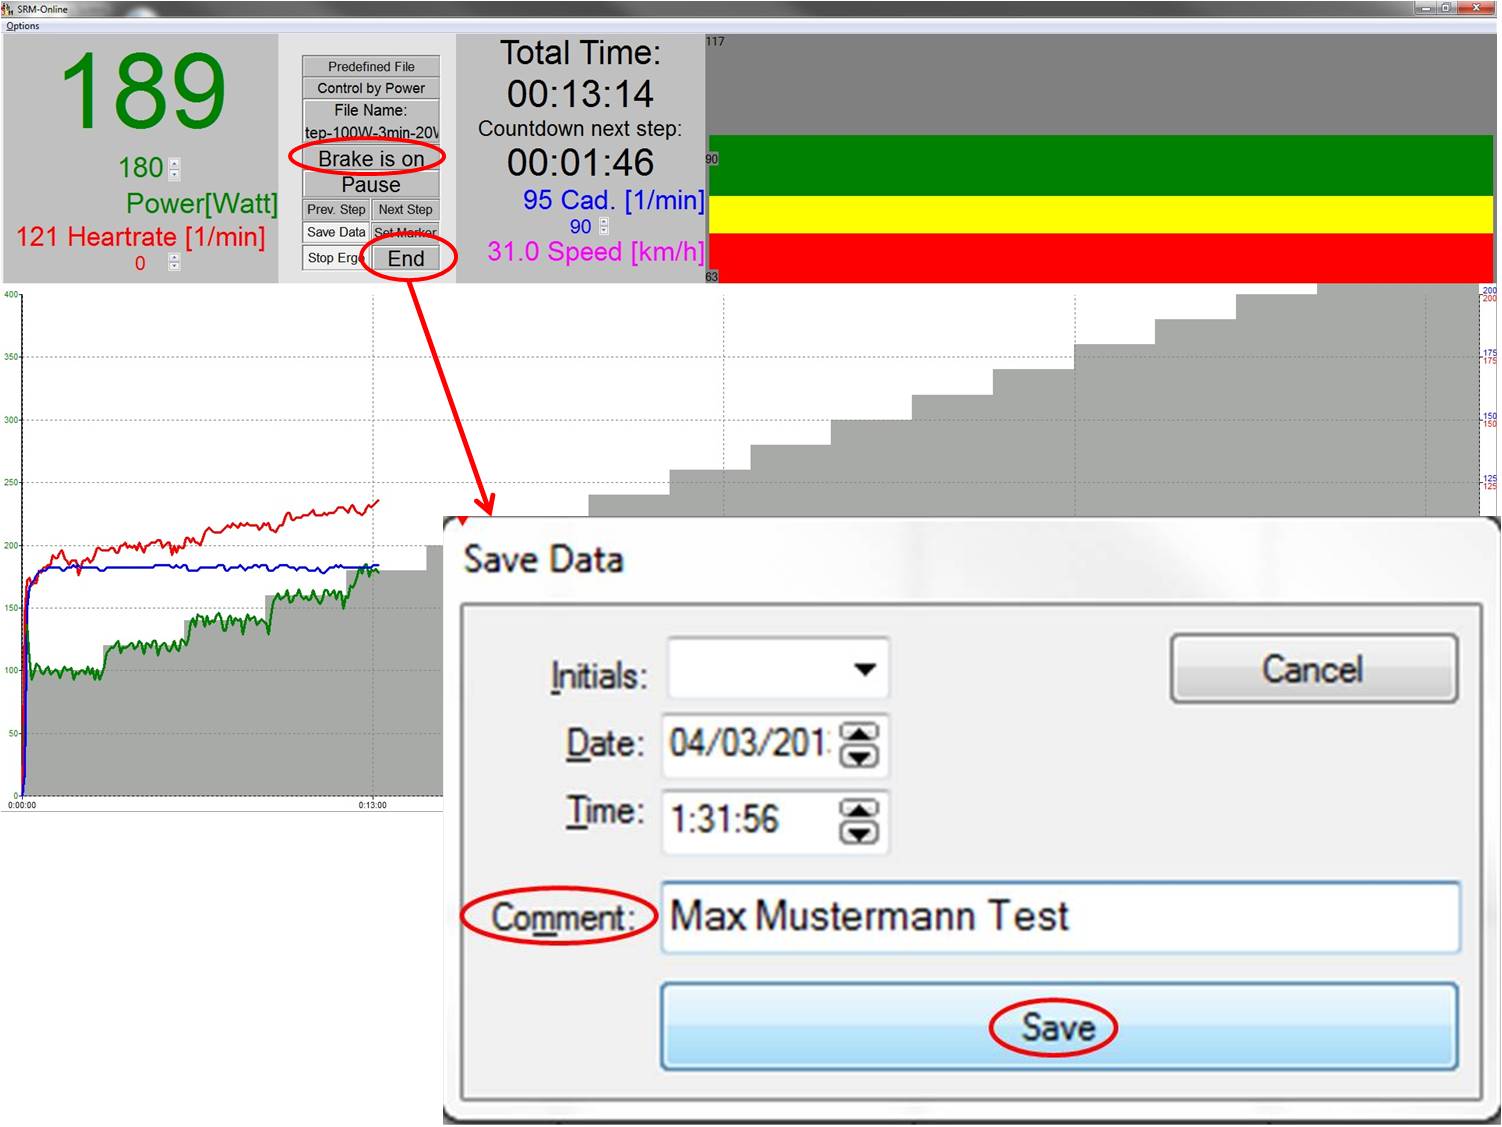
- If you are done with the test, click on Save Data to save the test. You can give remarks to the training under Comment. You can also make modifications for the Initials (Initials), the date (Date) and the time (Time). To complete everything successfully, please click on Save.
- By clicking of Set Marker, you can place markers during the test.
- Stop Ergo works only in connection with the Ergometer and if there will be no cadence.
- You can end the test and leave the online program by clicking on Exit / End.
- In the upper part of the monitor image you can see four colored displays. In green you can see the display for Power, red shows you the Heartrate, blue the Cadence and pink the Speed. There is always a larger and underneath it a smaller number to be seen for each display. The larger values give you your current performance output while the smaller ones give you the targeted value for this block. The difference between the actual and the desired performance output is a result of the performance variation of the athlete. Differences up to 5 % are quite normal, but on average, the deviation will still be smaller than 1 % over the controlled period of time.
- You can increase or decrease the current guideline (power, heart rate, cadence) for the test via the arrow buttons (up / down).
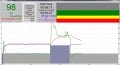
Isokinetic Performance Test
- The first grey block corresponds with the first planned power output of 100 watts
- The second blue block shows a targeted cadence of over 90 rpm
- The third red block equals the previously set heart rate guideline of 130 bpm
- If you train after cadence guideline Power or Heart rate is checked off on this level, the bars will show you the Power guideline. They help the athlete to get a better orientation and they have no influence on the regulation.
Protocol isokinetic Test
Practice isokinetic Test 1
Practice isokinetic Test 2


Heart rate controlled Performance Test

- If you have checked off heart rate in the Mode Tab, the guideline of the protocol is shown in the color red on the monitor.
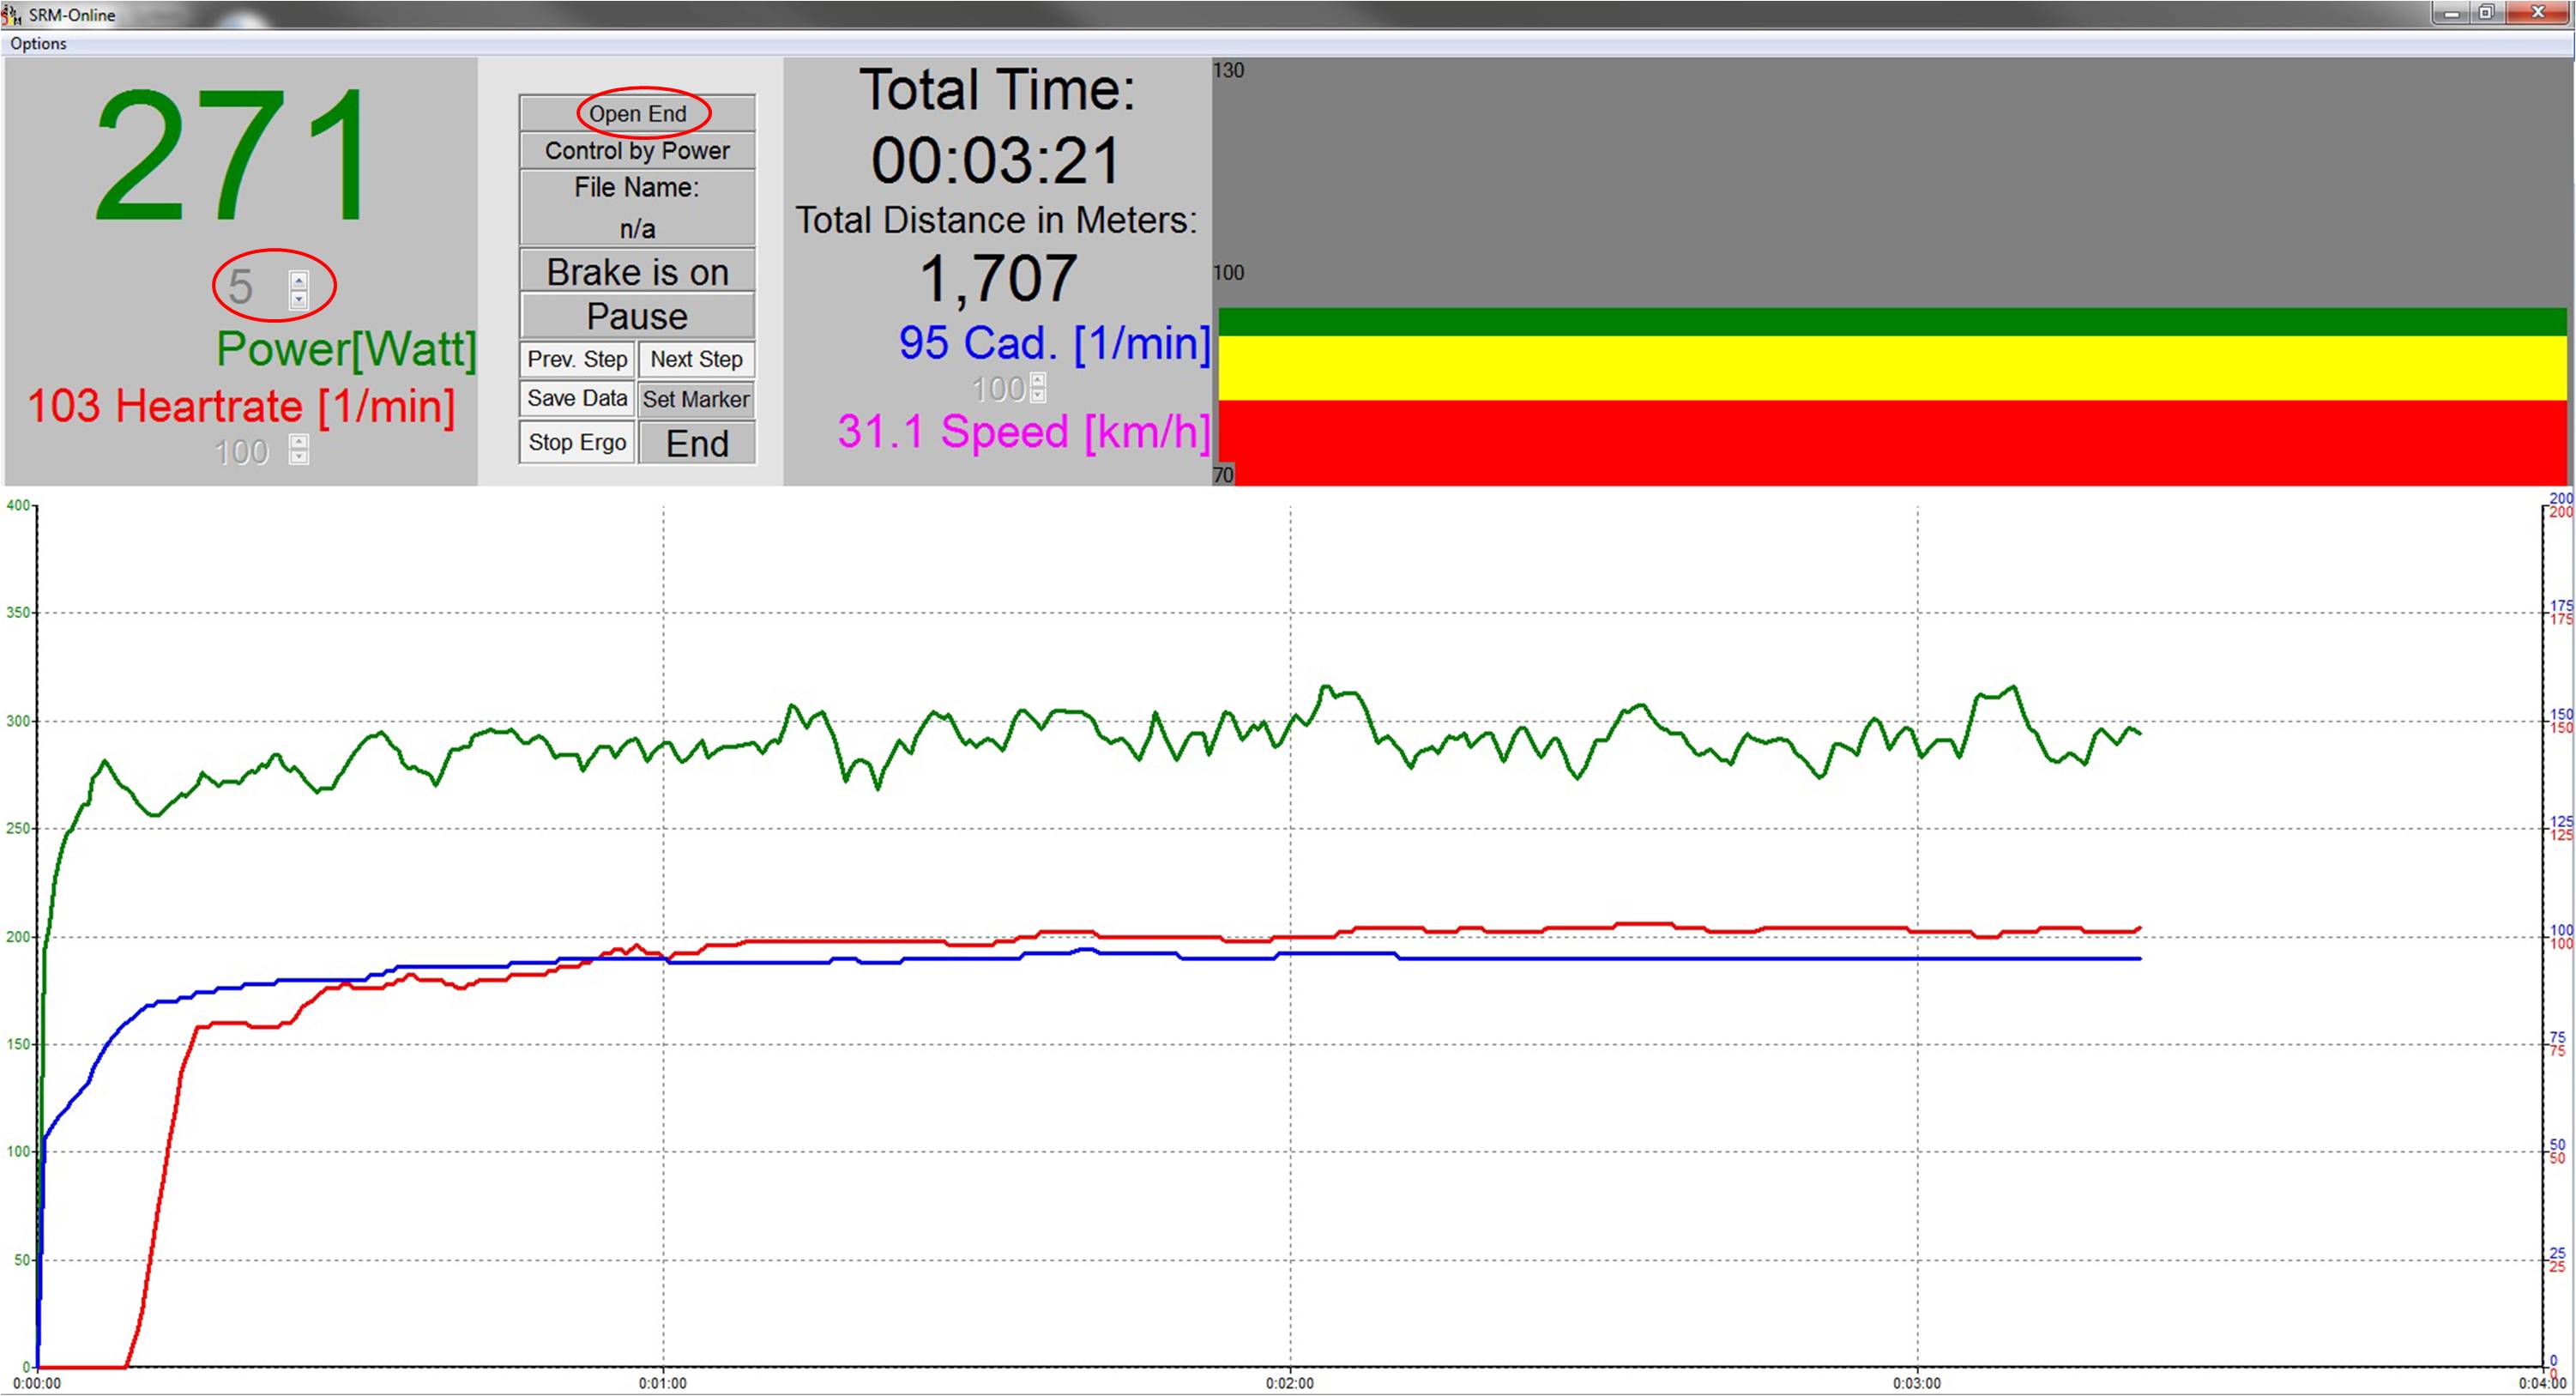
Open End Test
- By choosing Open End Test there will only be shown real time data on the monitor.
- In the upper middle part of the screen you can see the overall ridden kilometers.
- You can change the resistance via the arrow button (up, down) besides the little grey number in the upper left part of the screen. The scaling reaches from 0 to 10.
Troubleshooting
When you abruptly stop cycling after a short sprint (cadance of 0) it is possible to see some kind of plateau in the results at the power output and the cadance after the sprint. This emerges with a smoothing factor of 0%. The 2 images below provide clarification of the problem.
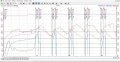
Sprinting protocol with plateaus at the power output and cadance
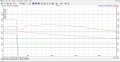
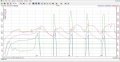
Zoomed in on one of the plateaus


Those plateaus arise because of the abruptly stop of cycling. At that moment the ergometer still sends the old values for 3 seconds until it drops to 0. It is recommended to change the values manually with SRMWin after saving, the last 3 seconds before a 0 cadence have to be deleted.
Another option is to download the data straight out of the PowerControl. By doing this you will download all the data of all the tests which has been performed since the last time this option has been used. So at first it is recommended to delete the data inside the PowerControl, than perform the test and finally download the data. How to use the download option see Data Export. The image below displays the same test as before downloaded from the PowerControl and without any plateaus.
Sprinting protocol without plateaus at the power output and cadance
