Torque Analyse
The SRM Ethernet Torque Analysis hardware and software is designed to display pedaling torque inputs in real time and provide the user with the ability to record and analyze data.
Torque data is useful when working to determine optimum bike fit, the result of changes made to position, athlete pedaling dynamics, and when working to rehabilitate after injury. Data collected can be saved, reloaded, and exported for use in various other applications and formats.
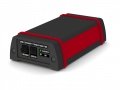
Frontview Torque Box
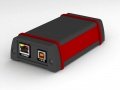
Backview Torque Box
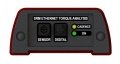
Frontview Torque Box
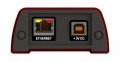
Backview Torque Box
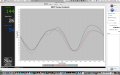
Maingraph Torque Analysis

SRM - Software: Monitoring the Torque Analysis
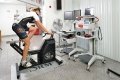
The Torque Analyses during Performance Diagnostics


Requirements
- SRM Ethernet Torque Analysis Box
- SRM Powermeter with wired coil and sensor cable
- Computer running either: MS Windows XP, Vista or 7; Mac OSX 10.5 or higher; or Linux Kernel 2.6 or higher
- Java Interpreter installed on the computer
- Ethernet connection and Cat5 patchcable
System Setup
Connections
The SRM torque analysis box will connect as follows:
- Sensor: Analog sensor cable
- Ethernet: LAN connection
- Digital: Reserved for future use
- + 5v DC: Power supply
- Cadence: indicates a revolution
- On: indicates if powered up
Note: Power delivery from USB port on a computer is not sufficient to run the SRM Ethernet Torque box. Please use the external power supply.
Frontview Torque Box
Backview Torque Box
Software preparation
- Download the latest SRM torque software from www.srm.de
- Install the software. If needed, Java runtime environment will be downloaded and installed automatically
Hardware installation
- Doublecheck PowerMeter installation/sensor cable
- Connect SRM Ethernet Torque Analysis Box to the sensor cable Use the analog input port of the SRM Ethernet Torque box
- Connect AC Power supply to the power input port of the SRM Ethernet Torque Analysis Box, check if power led (green color)is on (see troubleshooting for any problems)
- Secure SRM Ethernet Torque box in stable position
- Start pedaling and check if the cadence led (amber color) is flashing once per revolution
- Connect the network cable to the LAN port on the SRM Ethernet Torque Analysis Box and to your computer
Network setup

- Check the SRM Ethernet Torque box default IP address on the bottom of the outer case. The last digit of your PC's IP address (see next step) has to differ from the one of the torque box.
- Choose a free and valid IP address for your computer in the same subnetwork as the SRM Ethernet Torque Analysis Box (192.168.0.x).
- If you are using MS Windows: Press „Start“ button, open „Control Panel“, select „Network and Sharing Center“, click „View Network Connections“, right click on the connection you need to change i.e. LAN) then „Properties“, on „Network“ tab double click on „Internet Protocol Version 4 (TCP/IPV4)“ and insert the choosen IP address.
- If you are using Apple OSX: Launch „System Preferences“ from the Apple menu (or Spotlight), click on the „Network“ icon, in the lower right, click on the „Advanced“ button, in the pulldown menu next to „Configure IPv4 „select „Manually“ and insert the chosen IP address.
Software setup
- Launch the SRM Torque Software
- When the software first runs, a writable folder needs to be defined to save the data. Select a folder.
- Main screen is now shown; go to Settings by clicking on the lower right corner button or through the Options-Settings on the top menu and configure the program
Start pedaling, and check the connection indicator on the lower left corner of the screen: this indicator should be green, if not go to log tab and check the messages. Program settings and log file will be stored under the user's document folder:
Win XP: C:\Document and Settings\Document\SRMTrainingSystem\SRMTorque
Win Vista/7: C:\Users\Document\SRM TrainingSystem\SRMTorque
OSX: /User/Documents/SRM Training System/SRMTorque
Screens
Main screen
The majority of this screen is taken by a graph showing online data:
- the x-axis of this graph is measuring the angle of revolution in degrees
- the y-axis represents the torque in Newtonmeters.
The right side of this screen has two buttons: Record /Stop and Reset Pressing the Record button begins recording, pressing the Reset button clears all stored data. Here you can define the „Automatic stop“ settings. Selecting „None“ will result in recording revolutions until stopped manually.
Selecting „Revolutions“ will result in recording the specified number of revolutions entered. Selecting „Time“ will result in recording the specified seconds of time entered.
The „Notes“ area is for entering information specific to the revolution data that you record; any notes entered here will be displayed in the revolution table in the „Analysis“ view.
Directly below the main graph, there is a field showing numerically the index of the revolution with the relative cadence and power.
The bottom of the main view has a tracking feature which allows you to see specific angle and torque data as you mouse over the graph.
Analysis screen
The top part of this view contains a revolution table, showing data from all recorded revolutions with the appropriate graph for the selected revolutions underneath.
Zoom with the mouse. Hold the left mouse button and open a zoom window or turn the mouse wheel to zoom in/out. Click and hold the left mouse button and wipe left/right to zoom out. The right graph can be set to show two different torque graphs: „Overlapped“ and „Rounded“: „Overlapped“ displays torque data split into two series: from 0 to 179 and from 180 to 359 degrees.
„Rounded“ displays torque data split into 2 inverted series to better visualize roundness of complete revolution.
Note: Moving the mouse cursor over the revolution line in the graph will popup a message that shows the degrees of the relative series. Selecting multiple revolutions results in the graphical display of all revolutions (For windows operating system, this is done by pressing Ctrl-Click. When using Mac OS, this is done by pressing Command-Click).
The right side of this view has an „Export - Save and Load“ area; to export data, first select the desired revolutions.
Then select the output format (CSV, PNG, or PDF) and choose what type of graph(s) you need. Pressing the „Export“ button will export all selected revolutions.
CSV File syntax (for each exported revolution): ROW 1: Header: Index, Cadence, Power, Torque, Slope, Zero, Delay, CrankLenght, Weight, ROW 2 ... N: Body: Angle [Deg], Value [Hz]
To calculate the average graph of revolutions select two or more revolutions. Press the „Calculate Average“ button in „Data Operation“ area.
The „Save“ button allows you to save all checked revolutions (marked with the „Save“ column in revolution table); the number of revolutions is shown
on the „Save“ button.
All files will be saved in the data folder defined in the „Settings-System“ window.
The naming of the SRM Torque Analysis file (.sta) is:
„initials-YYYY.MM.DD HH.mm.SS.sta“
where „initials“ will represent the system's user name.
The „Load“ button allows you to open revolutions previously saved; press the „Load“ button, select a file, then press „Load File“ button (uncheck
„Update Statistics“ if you do not want the file to affect current statistics). Pressing „Select File“ allows you to Load another file; when all files are loaded, press „Close“ to exit the window.
The „Marker operation“ area is used to delete and colorize markers. First, select one or more revolutions, then click a starting point, followed by an ending point. The delta of these two points will be displayed in the lower left corner of the graph, showing both „Angle“ in degrees and „Torque“ in Nm.
Statistics screen
The upper half of this view contains two histograms that show the Cadence and Power distribution for all recorded revolutions.
The lower half of this view contains a scattergraph that shows the relationship between Cadence and Power for all recorded revolutions
Log screen
The Log view contains a complete listing of all relevent events that occured in the software during the current session:
- Connection information
- Save messages
- Load messages
- Device status
- Error notifications
- Recording events
Settings
The Settings window has 5 tabs. The „Graph“ tab allows you to change the number of simultaneous revolutions shown on the main graph, as well as select custom colors for each revolution by clicking on the color. The „Add“ and „Delete“ new revolution buttons allow you to change the number of revolutions shown between 1 and 10. Checking the „Automatic torque scale“ box will result in a self-adjusting y-axis for torque values. By leaving this box unchecked, you can manually select the maximum torque value shown on the y-axis of the main graph.
The „User“ tab contains the user information. The profile drop-down box contains a list of all available users with their information shown when selected.
To change any parameters to a user, select the appropiate user, insert the new value and click „Apply modification“ button. To delete a user, select user and press „Delete User“ button. To create a new user, input a user name for the profile, all the information, then click „Add User“ button. The current user profile is shown in red. To change the user, select a different user from the „User profile“ drop-down box, and click „Set Default User“ button; the current user information will be updated.
The most important information for a selected user profile as name, weight and crank length are shown in the statusbar on the bottom of the window when it gets updated.
The „PowerMeter“ tab is needed to change PowerMeter's parameters: the zero offset value and the slope of the PowerMeter as well to define where the revolution starts. The „Network“ tab allows to change all network settings like IP address and port.
The „System“ tab shows all network interfaces on your computer and is important when configuring your network address. Also, the destination folder for stored data can be changed here.
Utilities
Simulator
The simulator is a part of the SRM Torque Analysis software that allows simulation of revolutions; to enable this go to „Utilities - Simulator“ menu and
then press start.
Make sure to select „Simulator“ also in the „Network profile“ on the settings menu.
Cadence Bell
This option will enable a cadence signal for each revolution when the signal is triggered.
Troubleshooting
General
- Power LED doesn't switch on
- Check the power supply and the power cable connection
- Cadence LED doesn't flash for each revolution
- Check the position of the sensor: the correct position is a tangental point to the coil of the PowerMeter, at a perpendicular angle. Normally, this is a point 5cm from the center of the PowerMeter axle. Move or rotate the cable while pedaling until Cadence LED flashes.
- Power / Torque values shown on „Main“ screen are not accurate
- Ensure the PowerMeter settings are correct: check the slope and the zero offset values on Settings-Powermeter window
- No connection between the PC and the SRM Ethernet Torque Box
- Check the network configuration on your computer, ensure the IP address is the same subnetwork of SRM Ethernet Torque Analysis box
- SRM Ethernet Torque Box's IP adress lost
- Use the DeviceInstaller Utility to find and setup a new IP adress
- The revolution graph is not in the right position
- Check the relative parameter on „PowerMeter profile“ considering the activation point
- Position of the sensor cable
- Check position of sensor cable to ensure it is passing over the cadence switch at a distance in between 3 and 5 mm.
- Powermeter - no signal
- If the position of the sesnor cable is okay and still no signal of the PowerMeter is received, the battery might be the reason. The battery is not self-replaceable. You will need to send the PowerMeter for SRM for replacement. Battery life of the PowerMeter varies between PowerMeter models (700-1900 hours of use). If the variance of your zero-offset frequency is higher than normal and your hours of usage is in the range above 700 hours, your battery likely needs to be replaced.